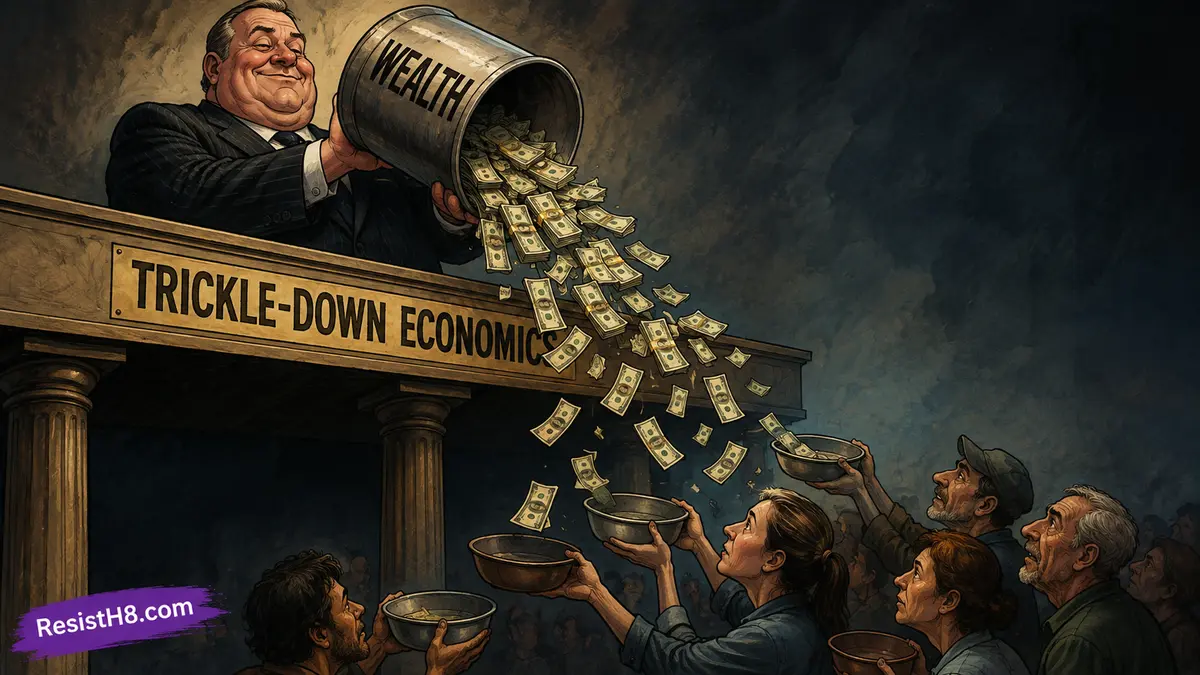

For more than forty years, American voters have been sold the same deal: cut taxes for the people at the top, and the money will find its way down to everyone else.
Better jobs. Higher wages. A rising tide, a bigger pie, pick your metaphor.
It has a name — trickle-down economics — and almost nobody who supports it uses that name. Here's where it came from, how it's supposed to work, and what the evidence actually shows.
Trickle-Down Economics Started as a Joke
The term wasn't coined by an economist. It came from a comedian.
In a 1932 column, humorist Will Rogers mocked Herbert Hoover's response to the Great Depression, writing that money had been handed to the top in the hope it would trickle down to the people who needed it, and noting that Hoover, an engineer, surely knew which direction water flows.
The line stuck.
Economist John Kenneth Galbraith later pointed out the idea had been tried in the 1890s under a more blunt name: the horse-and-sparrow theory — feed the horse enough oats, and some will pass through for the sparrows.
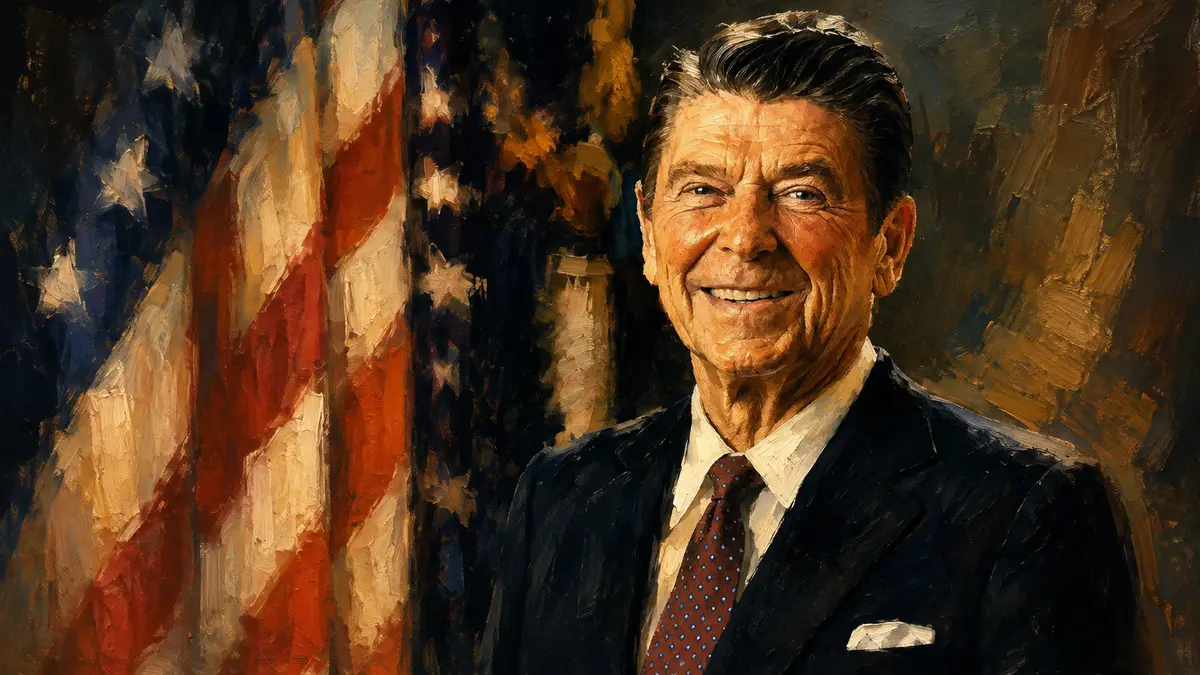
The modern version arrived with Ronald Reagan.
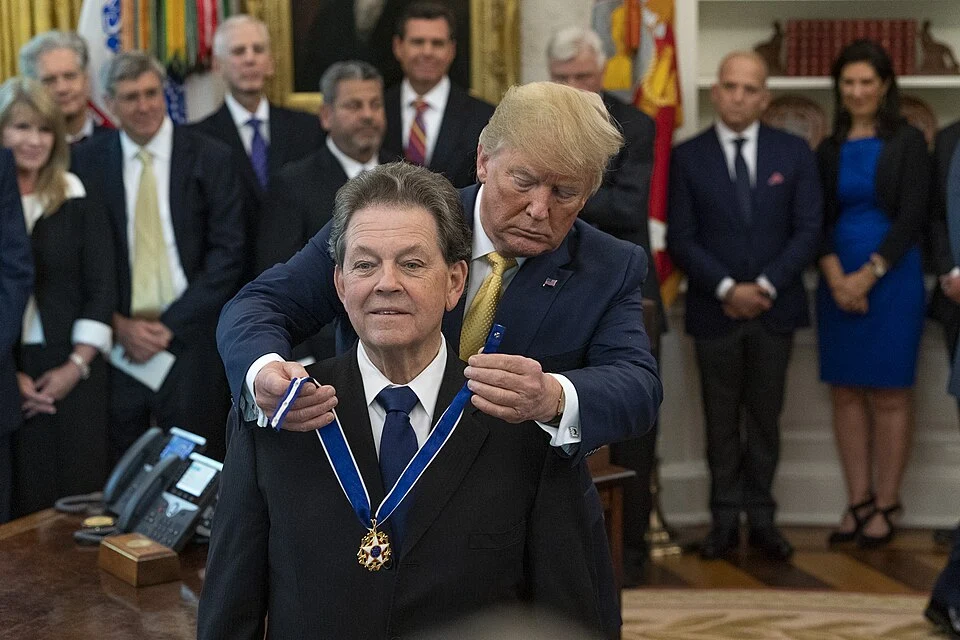
Working with Congress, his administration drove the top income tax rate down from 70 percent toward 28 percent, guided by economist Arthur Laffer and his famous curve, which suggested that lower rates could generate enough growth to partly pay for themselves.
Supporters called it supply-side economics.
Critics called it trickle-down economics.
Even David Stockman, Reagan's own budget director, later conceded that the supply-side framing was the sellable version of an idea nobody would vote for if you called it “trickle-down economics.”
How it's Supposed to Work
The logic is straightforward, which is part of its appeal:
- Cut taxes on corporations and high earners. They keep more of every additional dollar.
- They invest the difference — new factories, new equipment, new hires — because the after-tax return on doing so is now higher.
- More investment means more demand for workers, which pushes up employment and wages.
- The growth is big enough that tax revenue partly recovers and everyone ends up better off.
Deregulation usually rides along in the same package, on the theory that fewer rules mean lower costs and more expansion.
What its Defenders Say
It's worth being fair here, because the strongest version of the argument isn't the cartoon.
Supply-side economists generally reject the phrase itself.
Wharton's Kent Smetters has called trickle-down a disparaging sound bite rather than a real school of thought, and Thomas Sowell has argued you won't find a "trickle-down theory" in any serious economics literature.
Their claim isn't that rich people spend money and it splashes downward. It's narrower: taxes change behavior at the margin, and very high rates on capital discourage the investment that raises everyone's productivity over time.
And they have some evidence.
A 2024 study by Gabriel Chodorow-Reich and colleagues using firm-level tax returns found the 2017 corporate rate cut did increase investment, and projected a long-run wage gain of roughly 0.9 percent after 15 years.
Real, measurable — but a fraction of what was promised, and nowhere near enough to pay for the cut itself.
What Really Happened
The broadest test we have covers 18 wealthy countries across 50 years. Economists David Hope and Julian Limberg compared nations that passed major tax cuts for the rich against those that didn't, and found per-capita GDP and unemployment nearly identical five years later.


What did change was the income share of the top 1 percent, which rose by close to a full percentage point.
Their conclusion: cutting taxes on the rich reliably makes the rich richer and does little else.
The 2017 Tax Cuts and Jobs Act — sold to the public as rocket fuel for the economy — followed the pattern.
Brookings' review of the evidence found it added roughly $1.9 trillion to the debt over ten years with no clear gain in GDP, wages, or investment, while after-tax incomes rose most for the most affluent.
A Congressional Research Service analysis found average wages barely moved and the median wage actually fell.
Where did the windfall go?
Substantially into stock buybacks, which lift share prices for the people who already own shares.
Kansas ran the cleanest experiment.
Governor Sam Brownback slashed income taxes and zeroed out taxes on business profits in 2012, calling it "a shot of adrenaline into the heart of the Kansas economy."
Instead, job growth trailed most neighboring states, revenues collapsed, and schools and roads took the hit.
In 2017, his own Republican legislature repealed it over his veto.
Zoom out and the shape is unmistakable.
Before 1979, worker pay and productivity climbed together.
Since then, productivity has grown far faster than typical worker pay — the gap widened by nearly 44 percentage points between 1979 and 2019 alone.
The output was created. It just didn't land in paychecks.
Where This Leaves Us
The 2025 reconciliation law extended and expanded the 2017 cuts.
The Congressional Budget Office's own analysis found the result won't be evenly shared: resources will fall for households at the bottom of the income distribution while rising for those in the middle and at the top, largely because the tax cuts come paired with reductions in Medicaid and SNAP.
That's the part the metaphor was always designed to obscure. Someone pays for a tax cut.
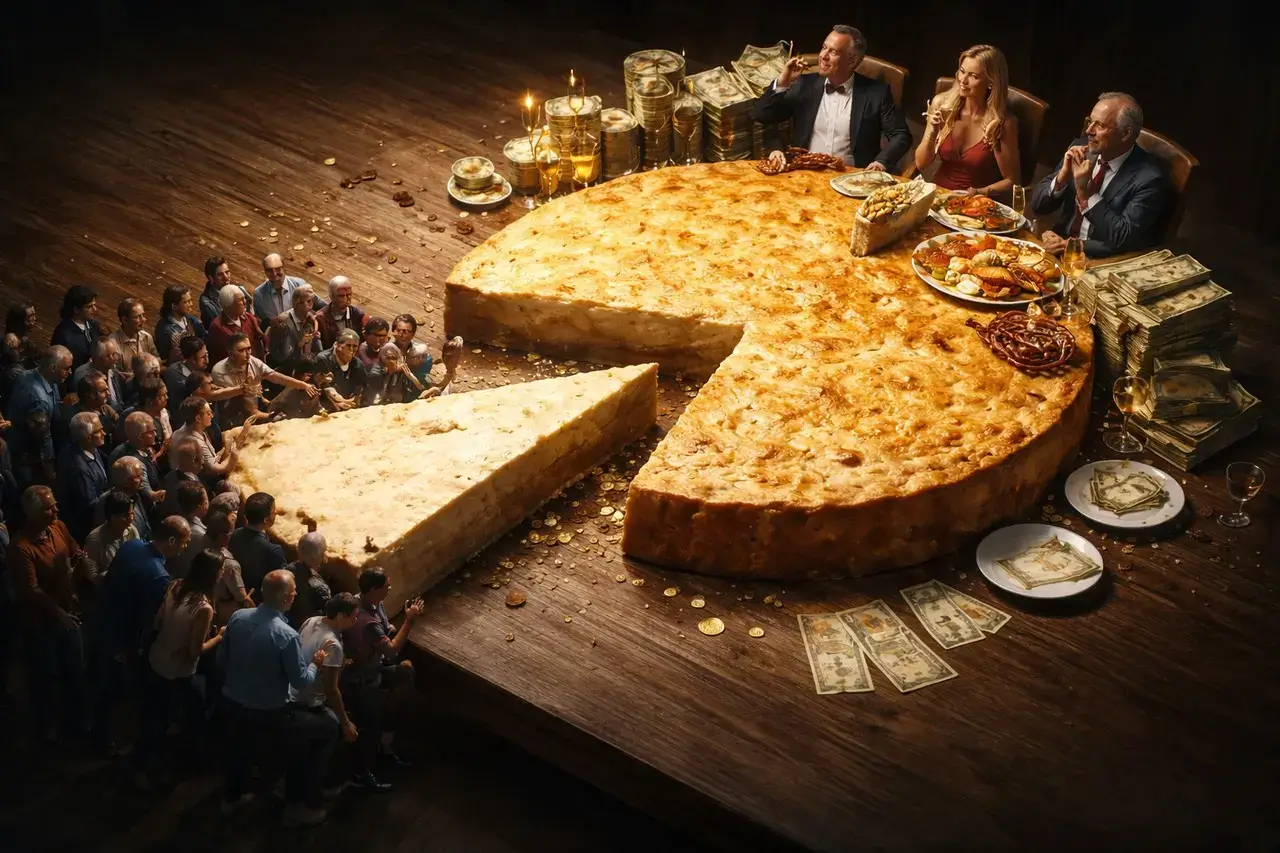
When the payment comes out of food assistance and health coverage, the water isn't trickling down. It's being pumped up.
Ask the next politician who promises otherwise for the receipts. Fifty years of them are already on the table.